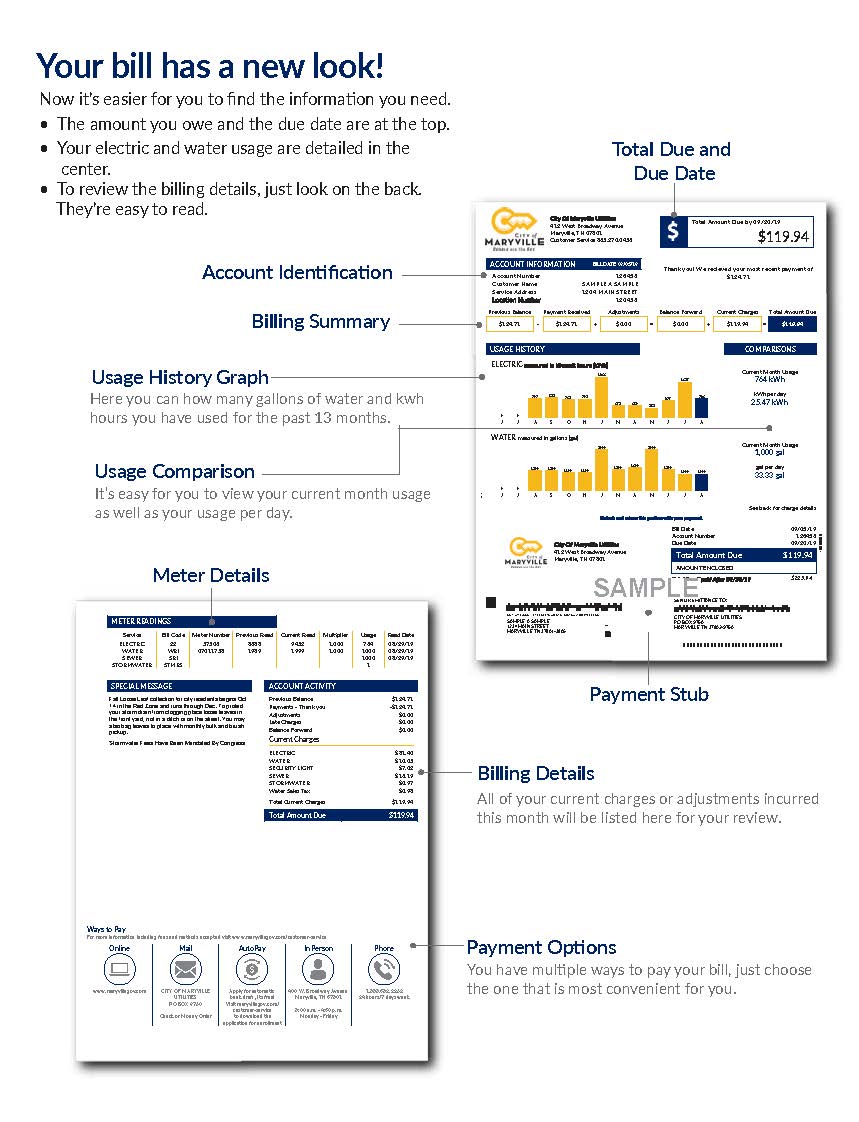
Due to the usage days and cycle schedule, there are currently situations where a meter may have two read dates in one month. For example, October 1 would be a read date for the previous month of September’s usage cycle and billed as of October 1. However, in this particular cycle, 30 days later, October’s usage is read on October 31, thus producing two read dates for two full months. Also note, that October’s bill would be billed October 31. Two separate billings recorded on the graph in one month.
We recommend looking at the itemized listing of charges on the back of the utility statement to review readings and amounts charged.
The graph and usage section of the bill are meant to give customers a picture of the usage patterns over a year’s time. However, the chart is strictly looking at monthly readings. So, if the readings fell on October 1 and October 31, the chart adds those two together as “October.” It also averages usage based on 30 days. So it will take the cumulative month’s readings and divide by 30. Therefore, it is not always an exact picture of the month’s usage, but over a year’s time will give customers average usage.
City of Maryville will continue to review and look for ways to provide the most accurate information to our customers.
What to do if you think there is a problem
At any time, if customers have questions about their bills or usage, we encourage them to contact us at 865-273-3456. City of Maryville customer service staff are always available to assist customers with questions about their bills.
Our process is to research the account, checking for inconsistencies or out of the ordinary numbers. In the review of the account if anything appears abnormal, we will send out a technician to check the meters. At that point, if required, a technician may be able to recommend areas to troubleshoot for leaks or other issues.
With a system that serves more than 14,000 customers, there can be any number of reasons for variations in utility usage bills. Size of homes, weatherproofing and energy efficiency, individual electricity and water usage habits, temperature of home, irrigation and pool usage, and so on. This is why it is important for customers to call and talk with our staff so that they can determine if there is a problem.
Environmental Factors
According to the National Weather Service, we experienced the driest September and the third driest month on record since 1871. Much of October included record high temperatures. Water and electric usage may have increased due to these conditions, especially if irrigation or other extra watering was in use.
Water saving ideas and information
The EPA has compiled some water usage statistics https://www.epa.gov/watersense/statistics-and-facts
Winter weather energy saving ideas
https://www.tva.gov/Energy/Winter-Weather-Saving-Strategies

 RSS Feed
